With the ballot for the North Carolina General Assembly set, this is a good time to get a lay of the electoral landscape ahead of the general elections. With that in mind, here is the 2024 Civitas Partisan Index (CPI).
We assigned a rating to each district based on its CPI score. We rate districts with a CPI of 0–1 in either direction as a toss-up, 2–5 as lean, 6–9 as likely, and ten or more as safe seats for the respective parties. Districts with a 0 rating have a partisan lean of less than half a percentage point.
(Scroll to the bottom to review our methodology for the CPI.)
The Partisan Leanings of North Carolina Senate Districts
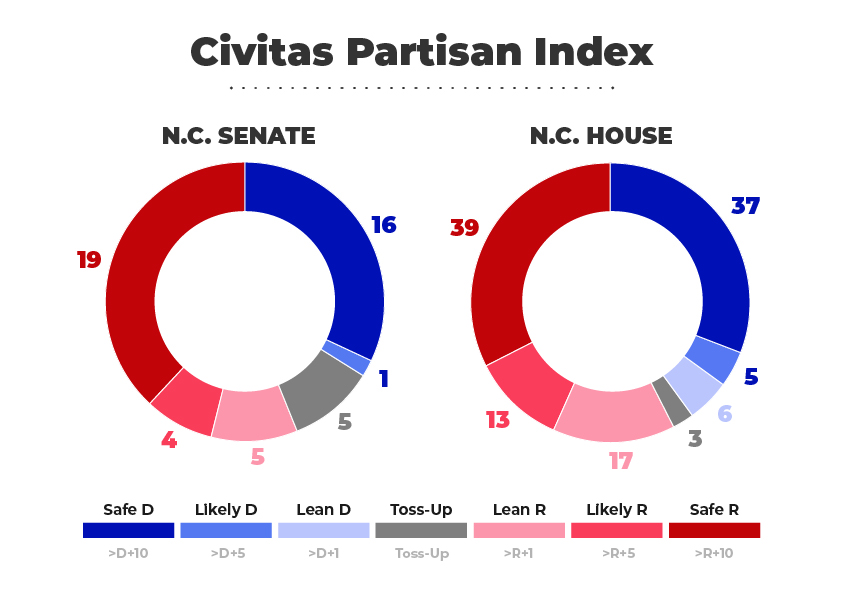
There are 50 seats in the North Carolina Senate. The CPI indicates that there are 16 safe Democratic seats, 1 likely Democratic seat, no Democratic lean seats, 5 toss-up seats, 5 lean Republican seats, 4 likely Republican seats, and 19 safe Republican seats in the state Senate.
Republicans start with 23 likely or safe seats in the Senate in a typical election year. They would need to pick up three Republican-leaning seats or toss-up seats to gain a majority. To get a super majority (the 30 votes needed to override a veto), Republicans would need to pick up all of the lean Republican seats and two of the five toss-up seats.
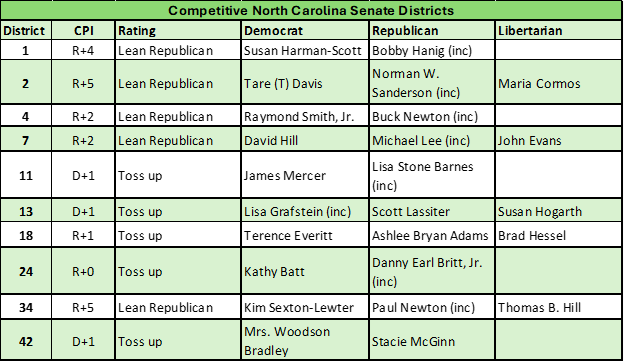
Democrats would need to sweep all the toss-up seats and win in three lean Republican districts to gain a majority.
Click on the file below to see a full list of CPI ratings and candidates for all North Carolina Senate districts.
The Partisan Leanings of North Carolina House Districts
There are 120 in the North Carolina House. The CPI indicates that there are 37 safe Democratic seats, 5 likely Democratic seats, 6 lean Democratic seats, 3 toss-up seats, 17 lean Republican seats, 13 likely Republican seats, and 39 safe Republican seats in the state House.
In a typical election year, Republicans would start with 52 likely or safe seats in the House. Republicans would only have to pick up eight of the lean Republican or toss-up seats to gain a majority in the chamber. To get to the 72-seat super majority, Republicans would need to pick up all the lean Republican and toss-up seats.
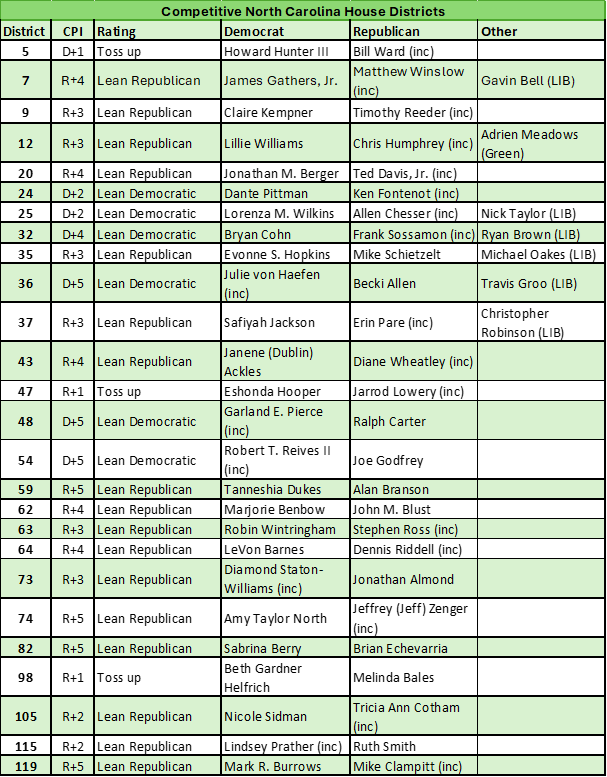
Democrats would need to sweep all three toss-up seats and win in ten of 17 lean Republican districts to gain a majority.
Click on the file below to see a full list of CPI ratings and candidates for all North Carolina House districts.
How we measure the political leanings of North Carolina legislative districts
We model the CPI after the Cook Political Report’s Partisan Voting Index. The CPI is a measure of the base partisan leanings of a North Carolina state legislative district compared to the state as a whole. For each district, the CPI score lists the party (identified by initials, D or R) the district tends to favor, followed by a number indicating the relative lean of the district toward that party. For example, a district that tends to vote about 7 percent more Democratic than the state average would have a CPI score of D+7.
The 2024 CPI takes precinct-level results of the ten 2020 Council of State races and the 2022 statewide judicial races using data from the North Carolina State Board of Elections (NCSBE) precinct sort files. The Republican votes of sixteen races were added together in each state legislative district and divided by the total two-party votes for those sixteen races to get a Republican percentage in each district. That percentage is then subtracted from the Republican statewide average for those sixteen races (51.36%), and rounded up to the nearest whole number, to find the CPI rating for each district. For example, if a district has an average Republican vote of 48.54 percent, it would have a CPI of D+3 (48.54 – 51.36 = -2.82)
By considering the deviation from the statewide average, the CPI somewhat mitigates effects such as incumbency, uneven races, or “wave” elections.
The 2020 Council of State races used in the CPI were for governor, lieutenant governor, commissioner of agriculture, commissioner of insurance, commissioner of labor, attorney general, secretary of state, superintendent of public instruction, state treasurer, and state auditor. The 2022 Judicial elections included two Supreme Court races and the four statewide Court of Appeals races.
There are two ways the CPI may differ from other indexes. First, other indexes may base their scores on a composite of different races (president or United States senator, for example). Second, other indexes might not base their rating on a comparison to the average statewide vote but instead, compare the two-party vote totals when rating a district. Those differences in methodology can produce what appear to be very different results. So, for example, the CPI scores the 1st North Carolina Senate District R+4, while someone using Dave’s Redistricting app might score it R+8. Both ratings are legitimate and indicate a competitive Republican-leaning district.
How to Use the CPI
The CPI is not a tool for predicting races since it does not include measures such as incumbency or measures of candidate quality such as funds raised. However, someone using the CPI without any other data would have successfully predicted over 94 percent of races in 2020 and 2022.
The CPI measures the general tendency of voters in a district to vote for one party or the other. Doing so creates a baseline measure that journalists, researchers, and others can use when examining North Carolina legislative races. Using the CPI can help you gain essential insights into the 2024 election.