The two congressional maps proposed in the Senate Redistricting and Elections Committee are not pretty.
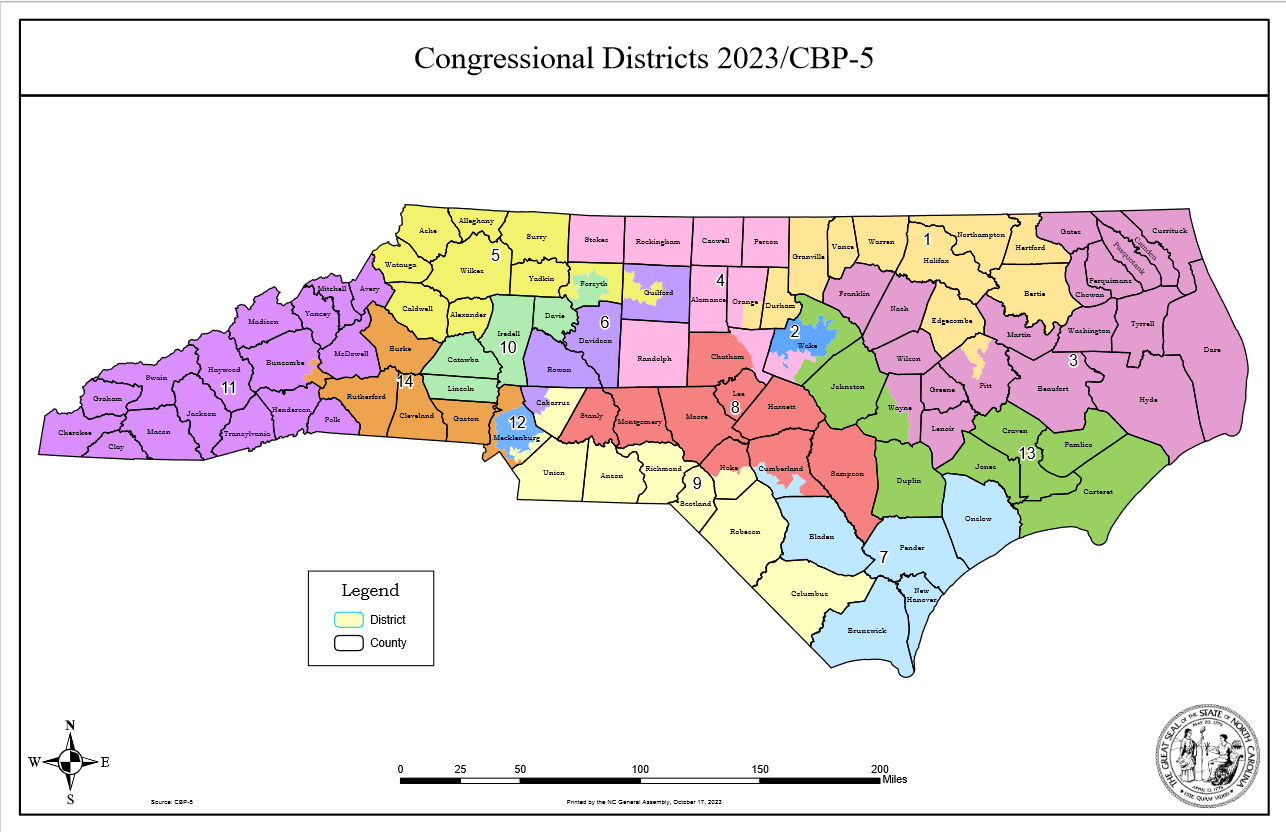
What the maps do with the 13th District is perhaps the most extreme example. On one map (CBP-5) it runs from northern Wake County all the way down to the beaches of Carteret County. On the other map (CCJ-1) the district is just as long but takes a long curve from the middle of the state before running along the Virginia line.
Other districts similarly look like pieces of modern art.
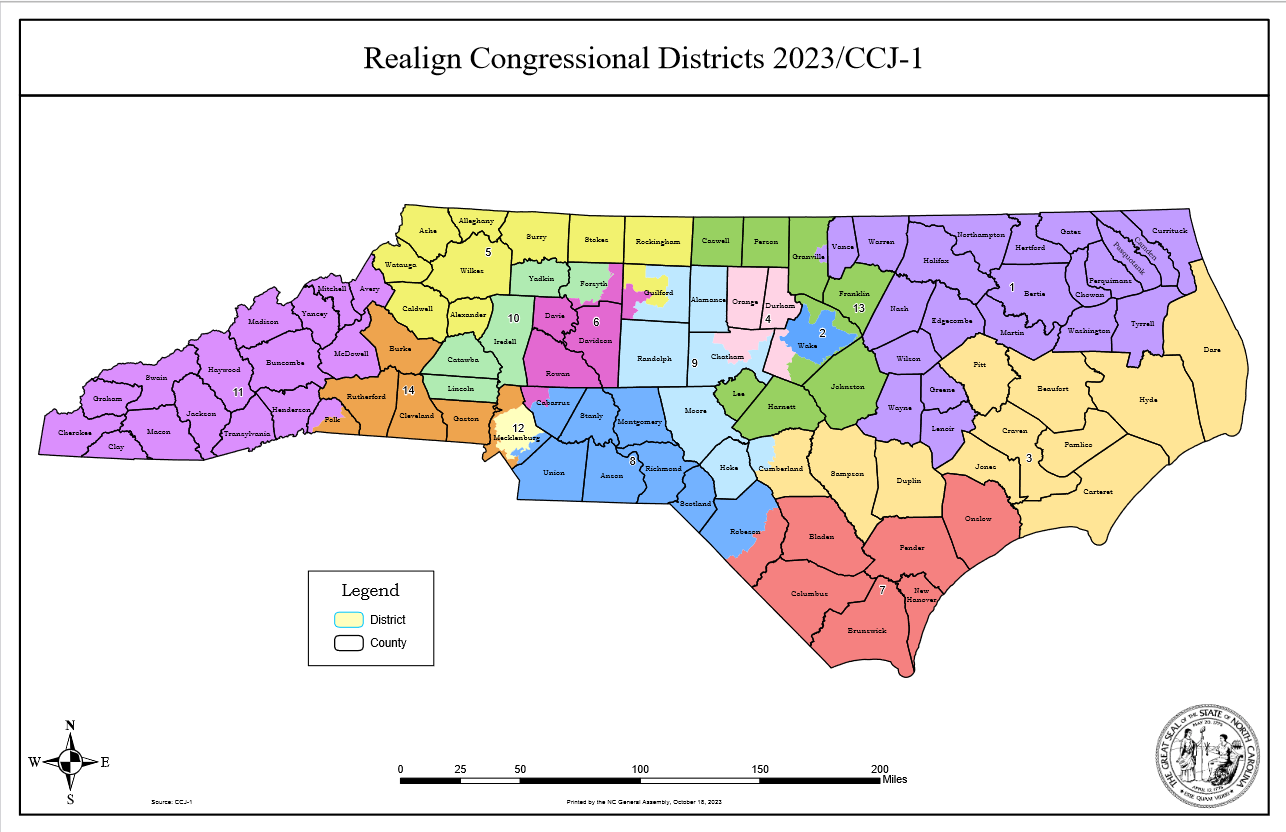
Despite that, the maps generally do a good job of following most traditional redistricting criteria.
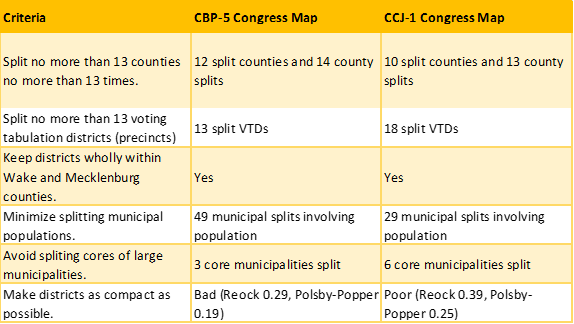
A research report published by the John Locke Foundation in May of 2023, found that there should be strict standards for minimizing splitting political subdivisions such as counties, municipalities and voting tabulation districts (precincts). Districts should also be reasonably compact and consider communities of interest.
As seen in the table below, both maps are fairly good on keeping political subdivisions whole.
One important exception is that both maps split the core precincts of large municipalities (defined as precincts wholly contained within a municipalities city limits). Another weakness of both maps is that their districts are less compact than they should be. That can be seen in both the compactness scores noted in the table below and by “eyeballing” the maps.
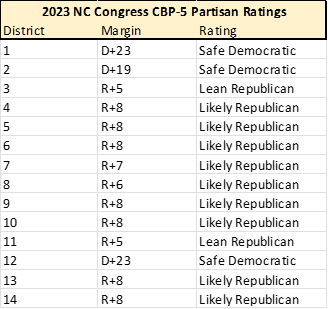
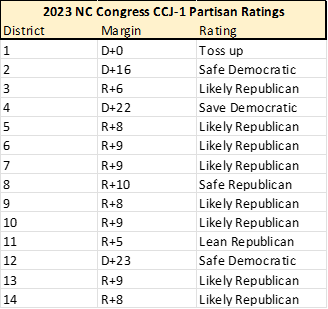
Both Maps Favor Republicans
To analyze the partisan leanings of the districts in both maps, we used a methodology similar to that of the Civitas Partisan Index.
We took precinct-level results of the ten 2020 Council of State races and the six statewide judicial races (North Carolina Supreme Court and NC Court of Appeals) using data from the North Carolina State Board of Elections (NCSBE) precinct sort files. We then assigned each precinct to a congressional district based on data provided by the General Assembly in their redistricting bills (SB 756 and SB 757). The Republican and Democratic votes of ten races were added together in each state legislative district and divided by the total two-party votes for those sixteen races to get a partisan percentage in each district.
As seem below the map in SB 756 gives Republicans an advantage in eleven of the state’s fourteen congressional districts. However, several of those districts are in the R+5 to R+7 range, meaning that Democrats could be competitive in them, especially as populations shift over the remainder of the decade.
The map in SB 757 provides a Republican advantage in ten districts with three safe Democratic Districts. It also provides one highly competitive district (Rep Don Davis’ First District). It is rated D+0, meanings that it has a Democratic leaning of less than half a percentage point. That part of the state is rapidly trending Republican, so it could soon be a difficult district for Davis to hold.
If the General Assembly approves either of these maps, North Carolina’s congressional delegation will be different from the even partisan split it currently has.