October 26 Update:
The General Assembly ratified amended versions of Senate Bill 758 and House Bill 898 on October 25. The changes are mostly minor and do not change the overall partisan ratings of either map previously listed in this post.
The updates to the Senate map include swapping precincts between districts 20 and 22 in Durham County and between districts 27 and 28 in Guilford County.
There are more numerous changes to the House map. They can be found on the summary page for HB 898.
Perhaps the most noteworthy change is that House Minority Leader Robert Reives’s 54th District changed from D+2 (lean Democratic) to D+5 (still lean Democratic).
Here are the updated Civitas Partisan Index ratings for all 120 House and 50 Senate districts.
Original post:
The North Carolina General Assembly recently released their proposed map changes for both the state legislature and congressional districts. To help people understand how those districts will likely affect the political landscape, we are releasing the 2024 Civitas Partisan Index (CPI) for the proposed House and Senate maps.
A breakdown of the congressional maps can be found here.
How We Measure the Political Leanings of North Carolina Legislative Districts
We model the CPI after the Cook Political Report’s Partisan Voting Index. It is a measure of the base partisan leanings of a North Carolina state legislative district compared to the state as a whole. For each district, the CPI score lists the party (identified by initials, D or R) the district tends to favor, followed by a number indicating the relative lean of the district toward that party. For example, a district that tends to vote about 7 percent more Democratic than the state average would have a CPI score of D+7.
The 2024 CPI took precinct-level results of the ten 2020 Council of State races and the 2022 statewide judicial races using data from the North Carolina State Board of Elections (NCSBE) precinct sort files. The Republican votes of sixteen races were added together in each state legislative district and divided by the total two-party votes for those sixteen races to get a Republican percentage in each district. That percentage is then subtracted from the Republican statewide average for those sixteen races (51.36%) to find the CPI rating for each district.
The 2020 Council of State races used in the CPI were for governor, lieutenant governor, commissioner of agriculture, commissioner of insurance, commissioner of labor, attorney general, secretary of state, superintendent of public instruction, state treasurer, and state auditor. The 2022 Judicial elections included two Supreme Court races and the four statewide Court of Appeals races.
There are two ways the CPI may differ from other indexes. First, other indexes may base their scores on a composite of different races (president or United States senator for example). Second, other indexes might not base their rating on a comparison to the average statewide vote but instead, compare the two-party vote totals when rating a district. Those differences in methodology can produce what appear to be very different results. So, for example, the CPI scores the 1st North Carolina Senate District R+11 while someone using the Dave’s Redistricting app might score it R+24 Both ratings are legitimate and indicate a safe Republican district.
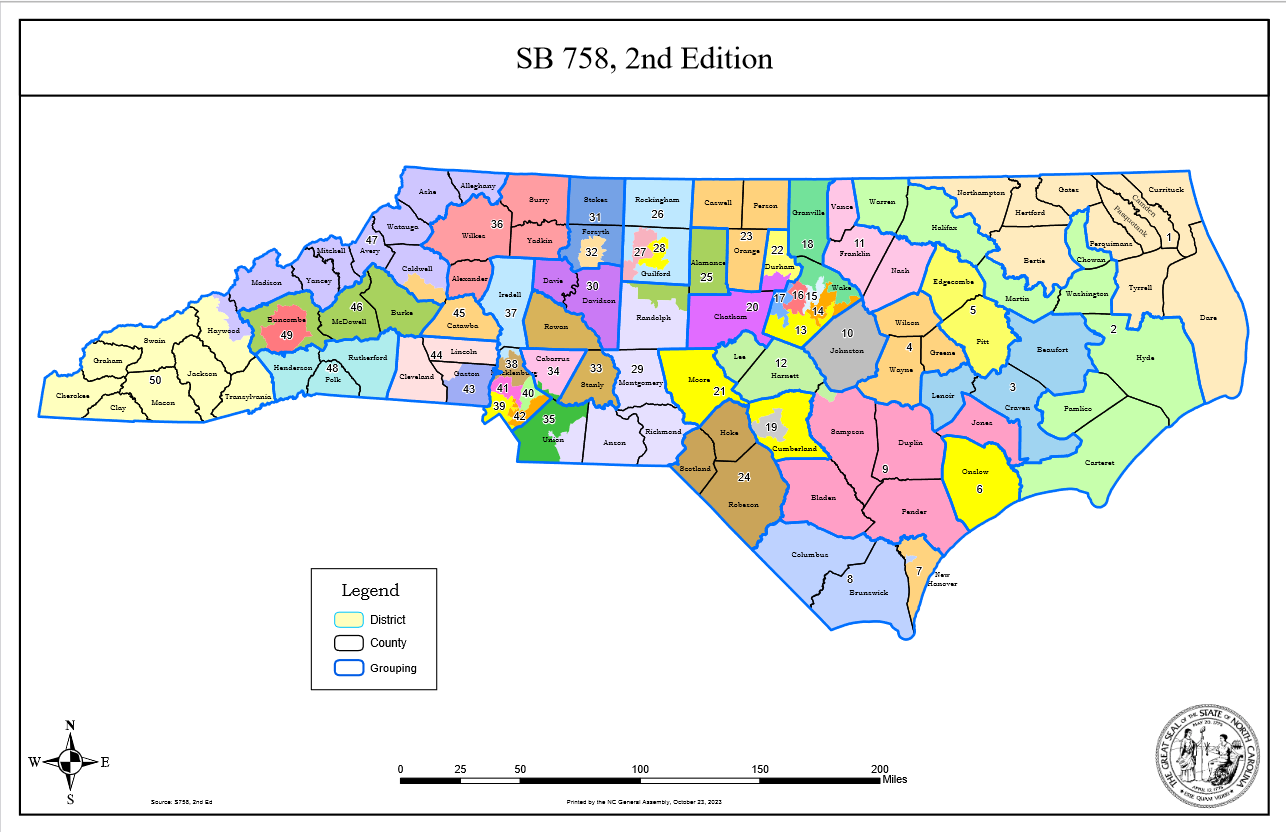
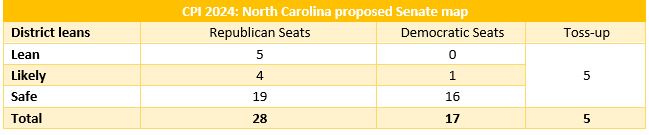
The Partisan Leanings of the New North Carolina Senate Districts
We also assigned a rating to each district based on its CPI score. We rate districts with a CPI of 0–1 in either direction as a toss-up, 2–5 lean, 6–9 likely, and 10 or more safe seats for the respective parties. Districts with a 0 rating have a partisan lean of less than half a percentage point.
There are 50 seats in the North Carolina Senate and requires a total of 30 seats to establish a supermajority in the chamber. The CPI indicates that there are 16 safe Democratic seats, 1 likely Democratic seat, 5 toss-up seats, 5 lean Republican seats, 4 likely Republican seats, and 19 safe Republican seats in the state Senate.
This would leave Republicans starting with 23 likely or safe seats in the Senate in a typical election year. To pick up a majority, they would need to pick up two of the Republican-leaning seats or toss-up seats. To get a super majority, Republicans would need to pick up 7 of the 10 lean Republican or toss-up seats for the Senate.
The Senate maps have a mean compactness score of 0.41 on the Reock test and 0.32 for the Polsby-Popper. The proposed map split municipalities a total of 42 times when accounting for county lines, and has a total of 11 precinct splits.
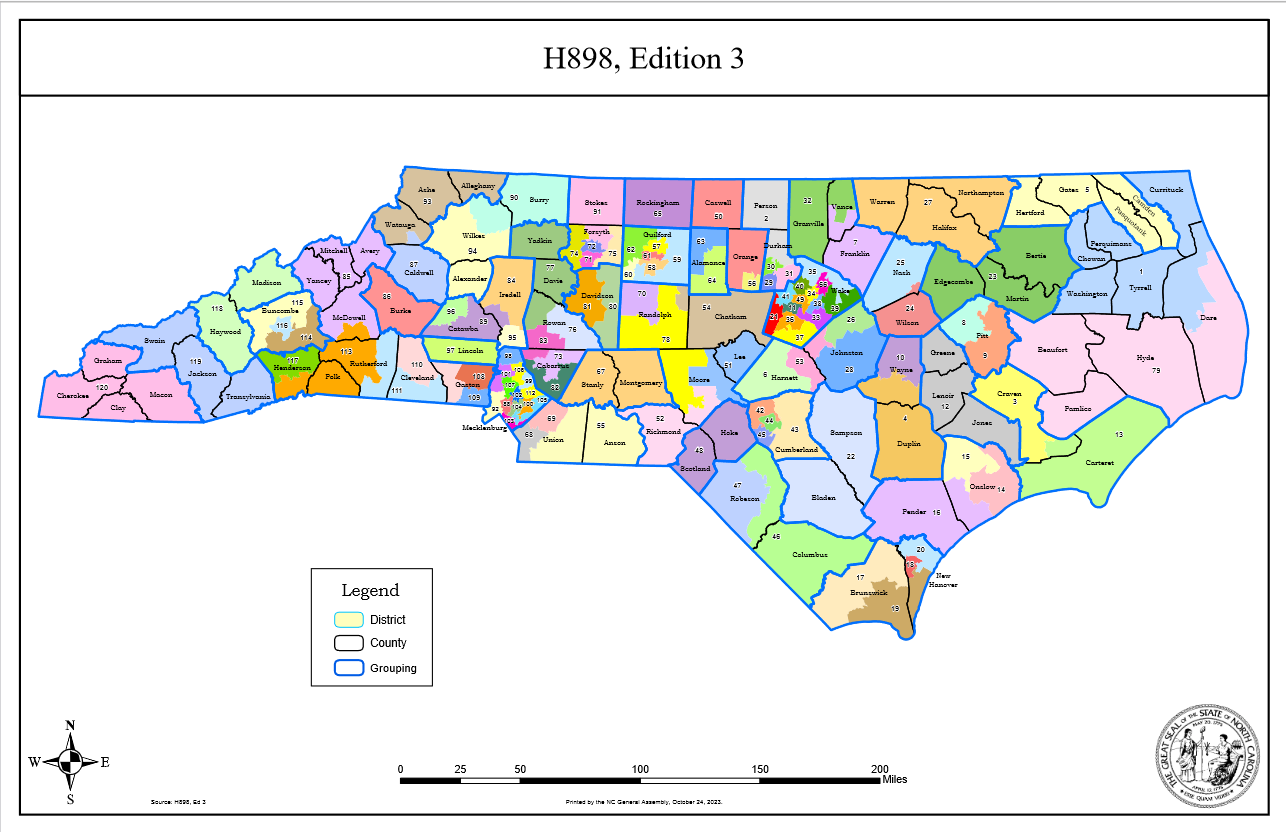
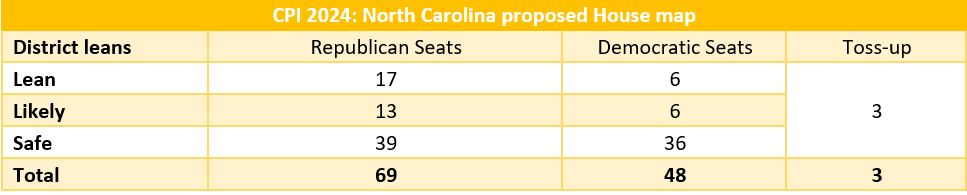
The Partisan Leanings of the New North Carolina House Districts
There are 120 in the North Carolina House and requires a total of 72 seats to establish a supermajority in the chamber. The CPI indicates that there are 36 safe Democratic seats, 6 likely Democratic seats, 6 lean Democratic seats, 3 toss-up seats, 17 lean Republican seats, 13 likely Republican seats, and 39 safe Republican seats in the state House.
In a typical election year, Republicans would be starting with 53 likely or safe seats for the state House. Republicans would only require picking up 8 of the lean Republican or toss-up seats to gain a majority for the chamber. To get a super majority, Republicans would need to pick up 19 of the 26 lean or toss-up elections.
As of this time, the House has not released a compactness data set. However, uploading the data to the online mapping site, Dave’s Redistrict, we find that the House maps compactness scores are a 0.4162 on the Reock test and a 0.3543 on the Polsby-Popper. The proposed house map splits municipalities a total of 87 times when accounting for county lines and has a total of 6 precinct splits.
How to Use the CPI
The CPI is not a tool for predicting races since it does not include measures such as incumbency or measures of candidate quality such as funds raised. However, someone using the CPI without any other data would have successfully predicted over 94 percent of races in both 2020, and 2022.
The CPI measures the general tendency of voters in a district to vote for one party or the other. Doing so creates a baseline measure that journalists, researchers, and others can use when examining North Carolina legislative races. Using the CPI can gain you essential insights into the 2024 election.