As we settle into the second week of absentee voting in North Carolina, let’s take stock of how voting by mail in North Carolina stacks up to previous midterm elections. This is also a good time to look forward to what districts may be close as ballots are counted on November 3.
Absentee [what about it?]
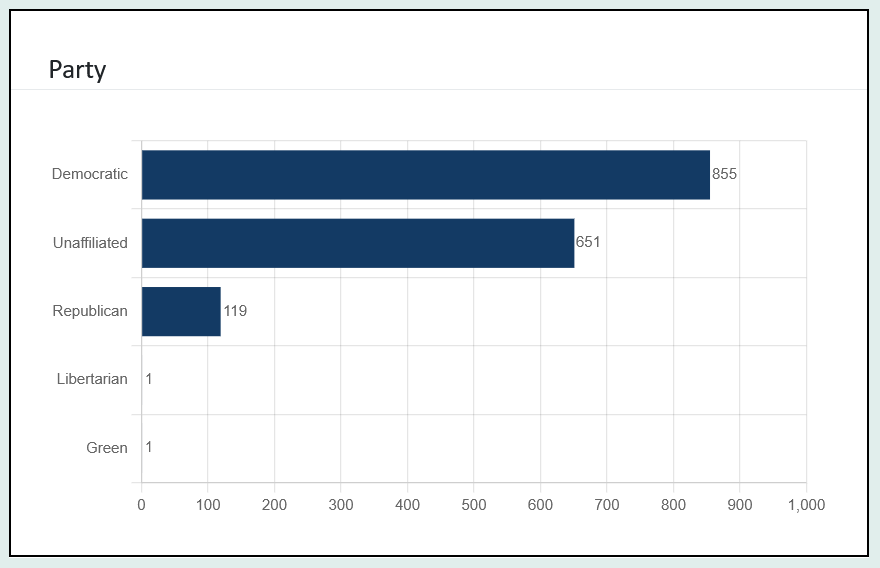
As seen at Vote Tracker, as of the morning of September 14, county election boards have accepted 1,627 absentee ballots. 52.6 percent of those are from Democrats, compared to 7.3 percent from Republicans. Both parties are down compared to a similar point in 2022, when Democrats had submitted 57.8 percent of accepted ballots, and Republicans had submitted 13.1 percent. Obviously, the proportion of unaffiliated voters has risen from 2022 to 2026 (28.8 percent to 40.0 percent).
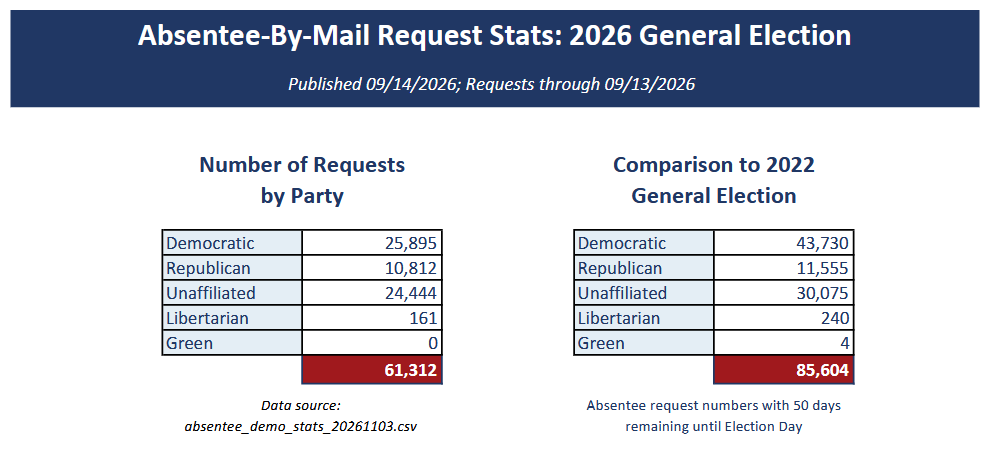
The total number of absentee ballot requests continues to lag behind the 2022 level and will likely continue to do so. 61,312 requests have been submitted compared to 85,604 at a similar point in 2022. Of course, fewer people voting absentee does not necessarily mean fewer people voting. Some voters in 2022 still had the habit of voting by mail after the COVID-affected election of 2020, and this year may represent a return to more normal voting patterns.
As seen in the chart below, Republicans account for a larger share of absentee ballot requests than they did at a comparable point in 2022.
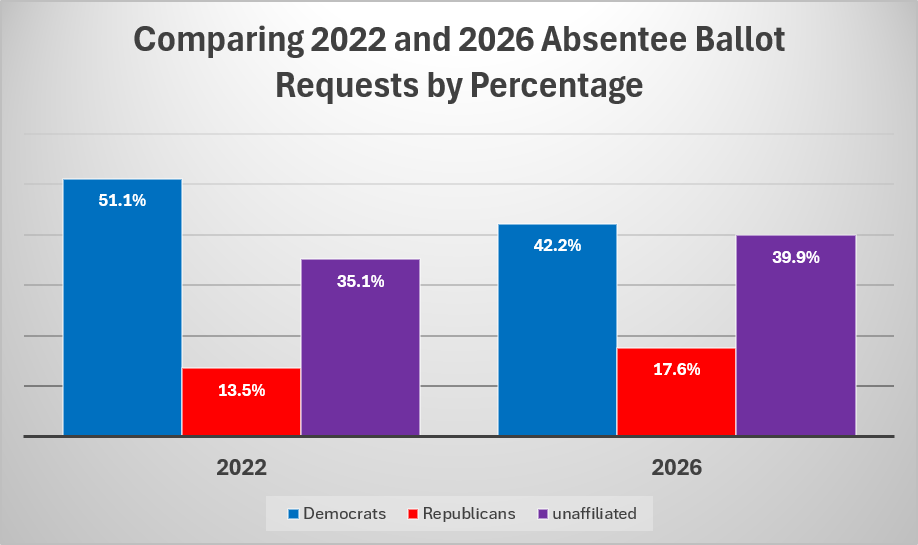
Again, however, that is probably more a reflection of some Democrats returning to their previous forms of voting rather than a drop of Democratic participation.
Both parties lag in voter registrations, but Republicans lag more
I compare voter registration numbers starting 15 weeks before the election to a comparable period in 2018, the previous Trump midterm election. The results through September 5 are in the chart below.
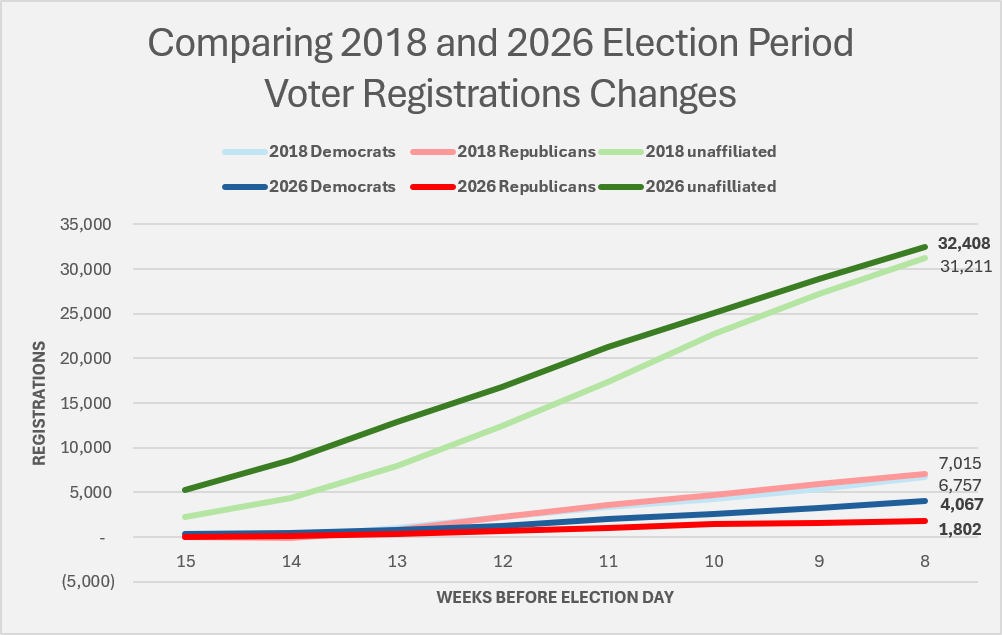
Republicans continue to lag well behind their 2018 numbers, with a net gain of 1,802 registrations so far compared to 7,015 at a similar point in 2018. Democrats are also lagging behind their 2018 numbers, but not by as much: 4,067 compared to 6,757. Unaffiliated is running ahead of its 2018 total, at 32,408 compared to 31,211. That gap has been closing over the past several weeks, however.
Which General Assembly districts are the most likely to be competitive?
The John Locke Foundation’s 2026 Civitas Partisan Index (CPI) is an analysis of the partisan baseline of all 170 North Carolina General Assembly districts. While CPI does not include factors like candidate quality or political environment, Someone using only the CPI would have successfully predicted the outcome of 98.8 percent of the races assigned a partisan lean in 2024.
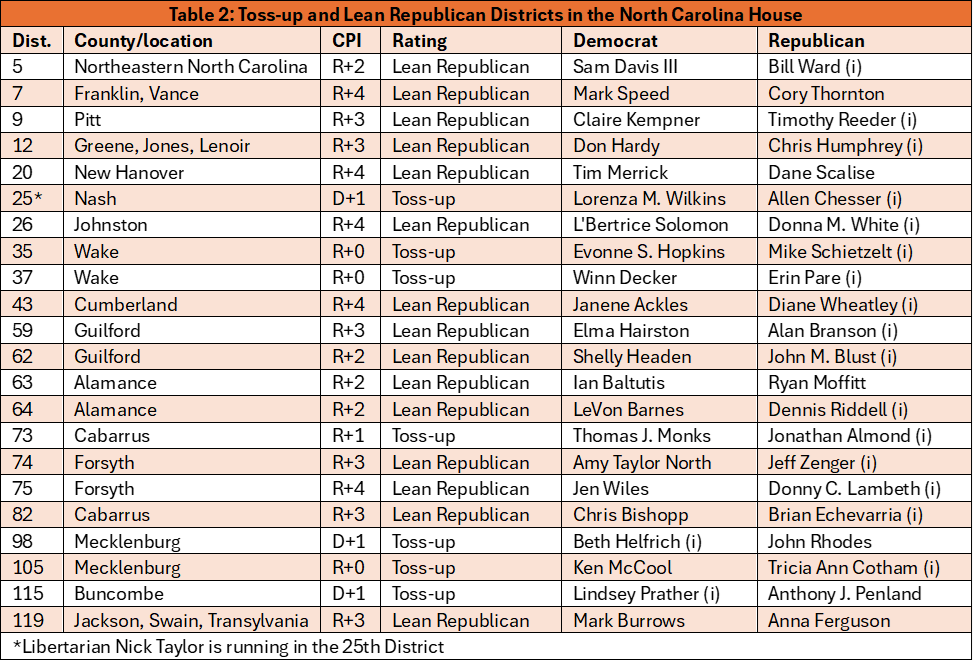
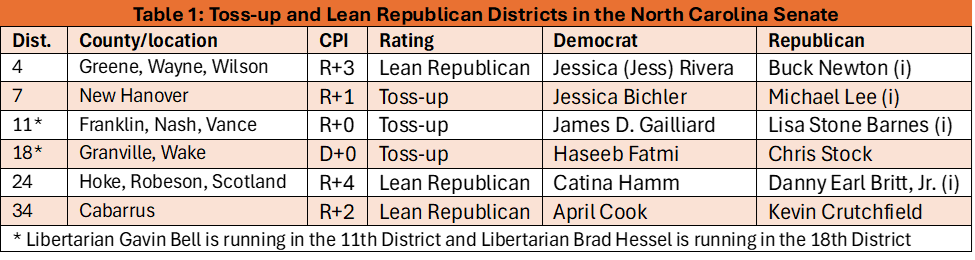
Based on our experience, the districts most likely to be competitive this year are those rated as “toss-ups” (rated as leaning less than two percent or less towards Democrats or Republicans) and those rated “lean Republican” (rated as leaning between two and five percent Republican).
As seen in the chart below, 22 of North Carolina’s 120 House seats are likely to be competitive, or about 18.3 percent
The Senate has fewer competitive districts, just six out of 50 (12 percent).
Click on the 2026 Civitas Partisan Index page for details on how the CPI is compiled.