The North Carolina General Assembly is expected to have its new legislative and congressional maps ready this week. The 2022 interim congressional map was always expected to be redrawn this year, as the court-drawn maps are only to be used for one election cycle. The redrawing of legislative maps only came about after the decision earlier this year on Harper v. Hall III, which threw out the court’s original ruling on Harper I.
Much like the 2021 redistricting processes, there is significant misinformation and false narratives in the map drawing process. The loudest of these narratives has been that North Carolina is a 50/50 state and, therefore, our legislature should represent that even divide. This proportionality argument has distilled into a new phrase: “Land doesn’t vote, people do.”
The problem with this argument is the geography of voters matters a lot when it comes to drawing maps, especially those for the state legislature. This is due to a county clustering requirement for North Carolina’s legislative maps referred to as the Stephenson Criteria.
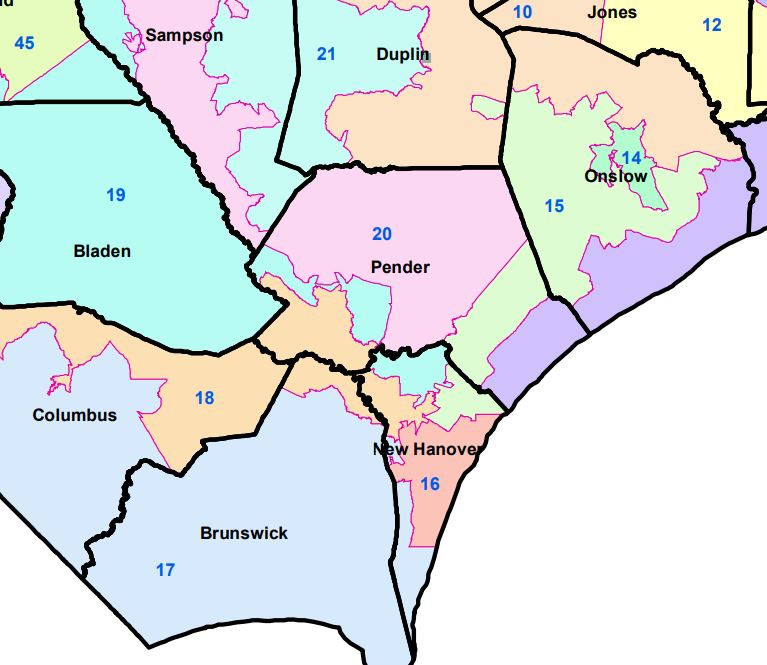
The North Carolina Supreme Court created these criteria during the early 2000s redistricting court case Stephen v. Bartlett. The court attempted to harmonize several conflicting redistricting requirements in the state constitution for legislative seats to have equal population and that no county shall be split for legislative districts, and federal requirements like the Voting Rights Act. The court found that the original 2001 map had a significant amount of unnecessary splitting of counties. It took special note of Pender County. Its population was 26,000 short of the population required for a single-House district. However, it was divided between several House districts.
The court’s answer to the legislature’s Rorschach maps was to pair off counties based on the ideal population for a district. If a county has a population within 5% of the ideal population to contain a single district, a district must be wholly contained in that county. Once the single-district counties are determined, legislators must find counties within the ideal range for two districts, then three districts, and so on.
Once the counties that can have districts wholly contained within their boundaries are determined, the process then moves on to the next step. This starts with determining counties that can be paired with one other county to make one or more districts. These counties must border one another and can only be traversed across their shared border once in when creating maps. Once these pairings are established, they match three counties, four counties, and so on.
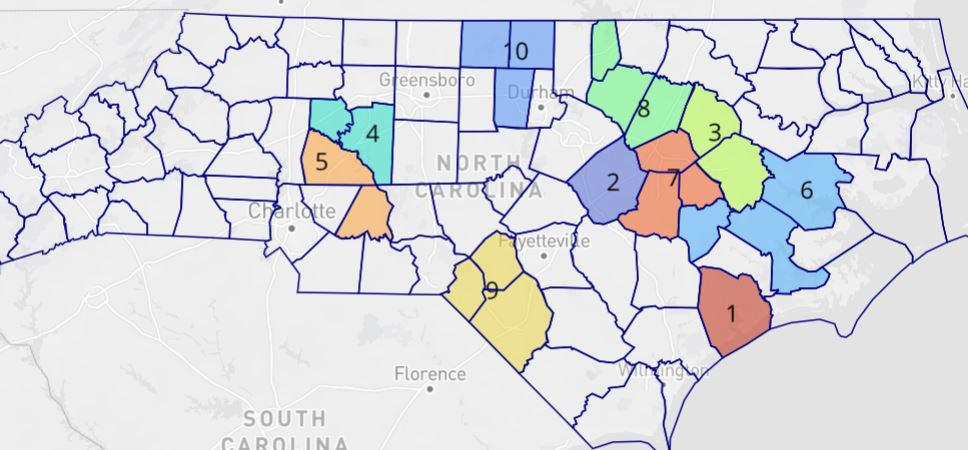
The Stephenson process automatically establishes several districts before map drawers even begin looking at maps. For example, the North Carolina Senate already has 10 of its 50 districts determined.
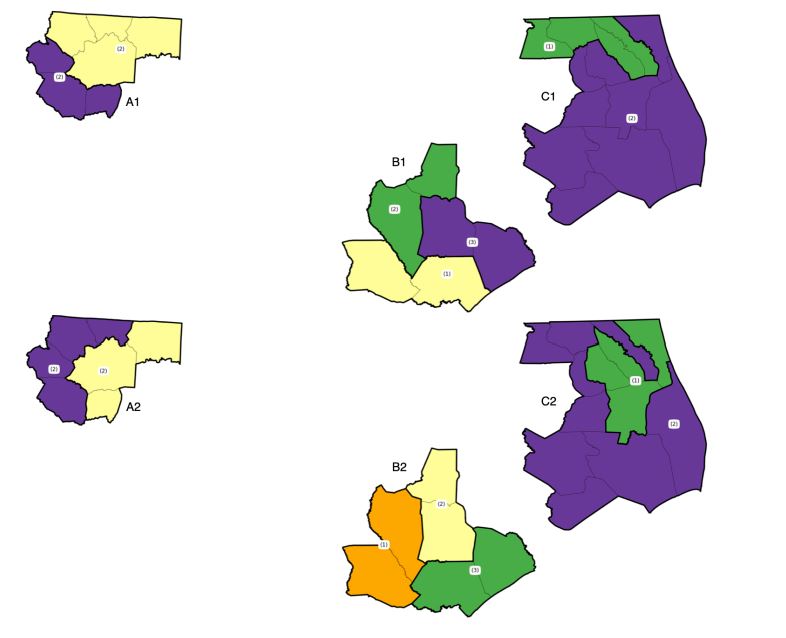
The process can lead to options for different county clusters, and map drawers may then choose which cluster to go with. These choices must align with the order of operation for determining clusters and comply with the Voting Rights Act. For example, map drawers can not opt to combine five counties into a cluster if, instead, they can be formed into a two-county cluster and a three-county cluster. Research from a group of researchers led by Western Carolina professor Christopher Cooper and The Differentiators both found that the Senate maps have two different options for four sets of county clusters.
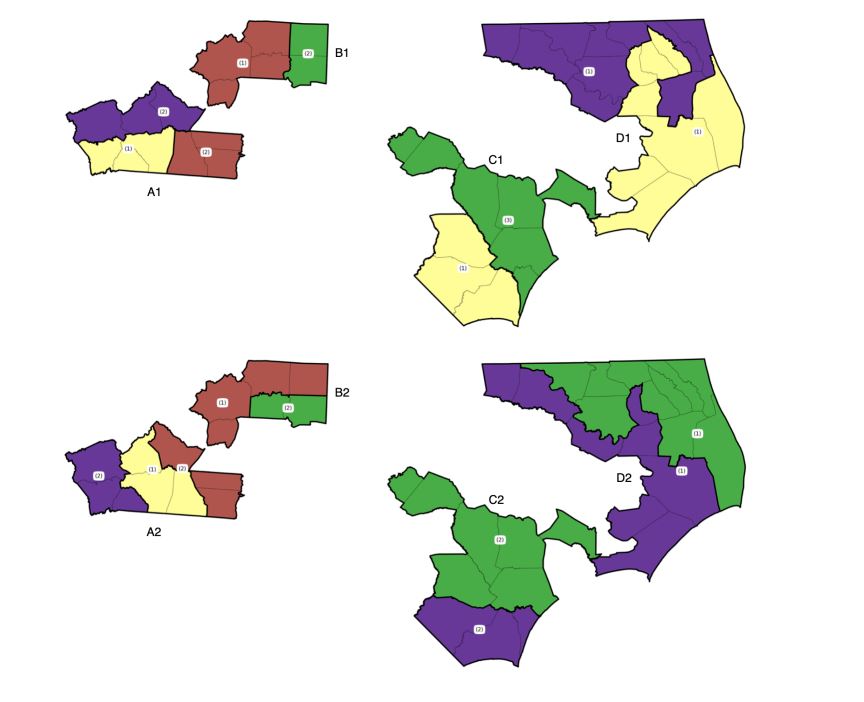
Both groups found that the House maps would have two different options for three sets of county clusters.
By requiring that counties be paired off for legislative districts and banning the previously used practice of transversing counties along multiple points, the Stephenson criteria limits the gerrymandering of state legislative maps. In effect, Stepheson makes map drawers have to section out their work. Rather than looking at the state as a blank canvas on which to draw districts, they must draw several pieces and make them fit together. This is why geography is essential in understanding legislative maps, as most of the state’s Democratic voters fall within a few urban areas. A recent North Carolina Chamber article illustrated this by mapping the North Carolina 2022 U.S. Senate election result.
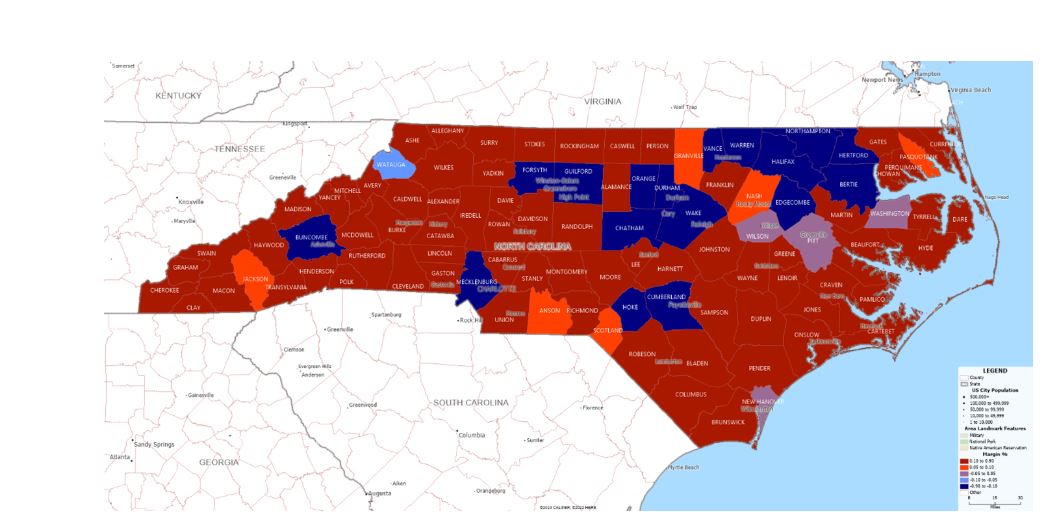
When we look at the demographic breakdowns and Stephenson’s criteria on county clusters, we understand that a competitive state for statewide elections like North Carolina favors Republicans for legislative seats. In the recent redistricting case, the plaintiff’s experts found the most likely outcomes for maps almost give Republicans a supermajority for the House and Senate based on the leans of the districts. The most likely result for the leaning of House districts is a 68-52 Republican map, while the Senate outcome is a 28-22 Republican-leaning map. This means Republicans would only need to win four toss-up/lean Dem seats in the House and only two in the Senate to get a supermajority.
In essence, even though Democrats are far more competitive in statewide races, Republicans are likely to have maps favoring them in the state legislature. Democrat voters are heavily packed into major metropolitan counties, while Republicans have an advantage in the majority of other smaller, more rural counties. While land may not vote, how voters are spread out matters a lot for the purposes of these maps.